How to Build a Live Accounts Receivable Dashboard with Claude Cowork
Claude Cowork's Live Artifacts turn a plain AR spreadsheet into an interactive collections command center - aging buckets, cadence stages, P2P tracking, and a daily action queue.
Prabhu
Q2C Automation Consultant
Most accounting firms track accounts receivable in a spreadsheet. The data is all there - invoice dates, balances, aging buckets, who you called last week. But a spreadsheet does not tell you what to do today. It does not flag that a promised payment was due yesterday, or that one client has gone four calls without picking up, or that $19,600 is sitting in the pre-legal bucket with no action owner.
Claude Cowork's Live Artifacts feature solves this with no code and no dashboard tool subscription. You upload your AR tracker, describe what you want to see, and Claude builds a fully interactive accounts receivable collections command center that lives inside the chat - date-filterable, tab-navigable, and wired to every row of your data.
This post walks through exactly how to do it, using a real AR tracker built for a multi-client accounting firm. The template spreadsheet is free to download.
What Claude Cowork Is
Claude Cowork is a mode inside claude.ai that adds two things beyond the standard chat: Projects (persistent context for ongoing work) and Live Artifacts (interactive HTML/React apps Claude builds and runs inline).
A Live Artifact is not a screenshot or a table pasted into chat. It is a running application - with charts, tabs, search, filters, and click interactions - that Claude generates from your data and then keeps as a pinned dashboard. You can reload it, share it with your team by opening the same project, and ask Claude to revise it at any time.
For accounts receivable collections, this is the fastest path from raw data to something actionable.
The Example Spreadsheet
The tracker used in this walkthrough is the AR Calling Automation Tracker, built for Cloudify Books & Advisors - a multi-client accounting firm. Download the free template here and adapt it for your own firm.
The workbook has nine sheets:
| Sheet | What It Contains |
| Invoices | All open invoices with aging days, collection stage, priority, last contact, and next follow-up date. Formula-driven - aging updates automatically from a single As_Of_Date config cell. |
| Customers | Client master list: contact details, risk tier, payment terms, preferred channel, and best call window. |
| Call_Log | Every outreach attempt with channel, outcome, sentiment, intent detected, and the AI-written summary from each call. |
| Promises_to_Pay | Commitments captured from calls, with promise date, amount, honor/broken status, and AI confidence score. |
| Follow_Up_Cadence | The rule engine - which stage triggers which channel, tone, and escalation at how many days past due. |
| Payment_Patterns | Per-client behavioral data: avg days to pay, P2P honor rate, best contact window, dispute history. |
| Dashboard | Formula-driven KPI summary used as the data source for the Claude artifact. |
The invoices in this demo span 27 open invoices across 15 clients, ranging from a bakery to a Series A tech startup to a mid-size real estate firm. Amounts range from $850 to $18,500. The As_Of_Date is set to May 17, 2026.
Building the Accounts Receivable Dashboard: Step by Step
Step 1 - Open Claude Cowork and create a project
Go to claude.ai, switch to Cowork in the top nav, and create a new project called something like "AR Collections - [Firm Name]". Projects give Claude persistent memory of your spreadsheet across sessions.
Step 2 - Upload the spreadsheet
In the project chat, attach your Excel file and send this prompt:
"This is my AR collections tracker. Build me a live dashboard artifact with: headline KPIs at the top (total AR outstanding, invoices past due, active promises to pay, P2P honor rate, open disputes, pre-legal count), an AR aging bucket chart, an invoices-by-cadence-stage breakdown, a daily action queue, and tabs for Invoices, Call Log, Promises to Pay, Customers, and Payment Patterns. Use the As_Of_Date from the Config sheet to anchor all aging calculations."
Claude will read every sheet, understand the formula logic, and generate a self-contained React artifact.
Step 3 - Pin the artifact
Once generated, click Pin in the artifact header. It appears in your project sidebar under Live Artifacts so you can open it any time without re-uploading the file.
Step 4 - Iterate
Ask Claude to adjust anything: change the color scheme, add a filter, surface clients with P2P confidence below 70%, or add a "calls this week" counter. Each revision updates the pinned artifact in place.
The prompt in Step 2 covers the dashboard. For the rest of the AR workflow, stage-matched collections emails, structured call log extraction, dispute briefs, and honor-rate-weighted cash forecasts, see the AR Prompt Playbook: 15 prompts built against this same tracker schema.
What the Dashboard Shows
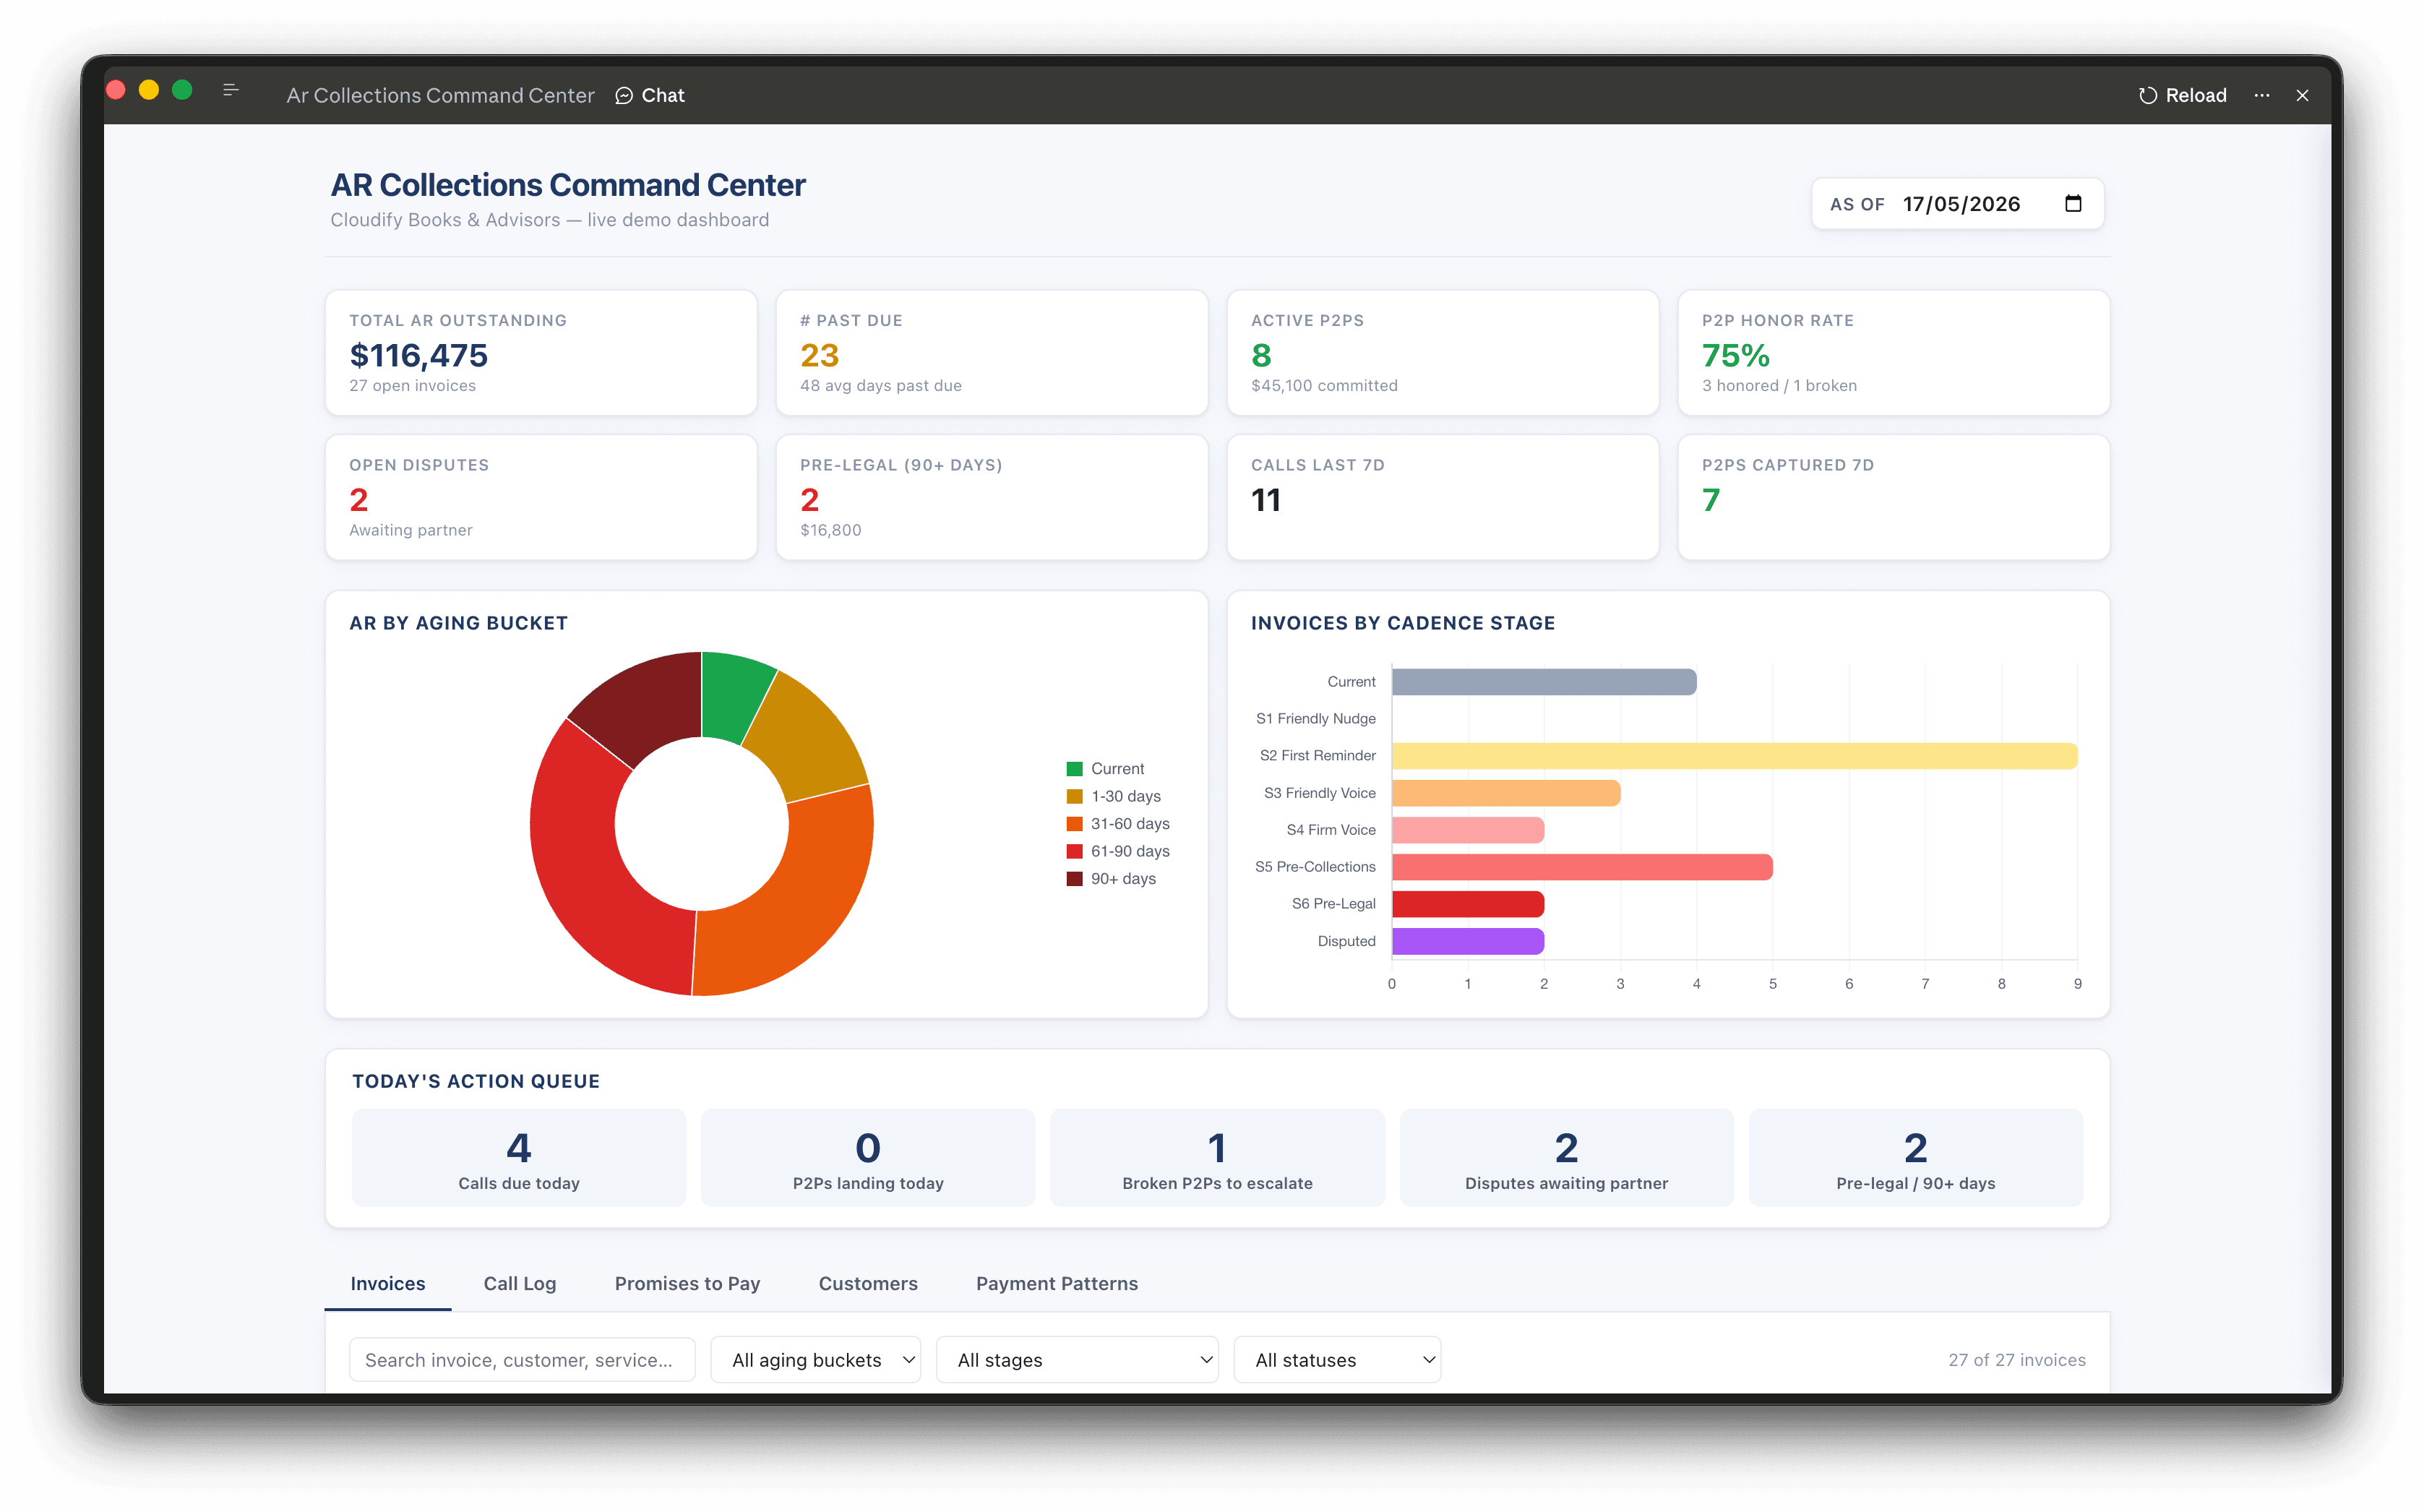
Here is what the AR Collections Command Center looks like for the Cloudify Books demo:
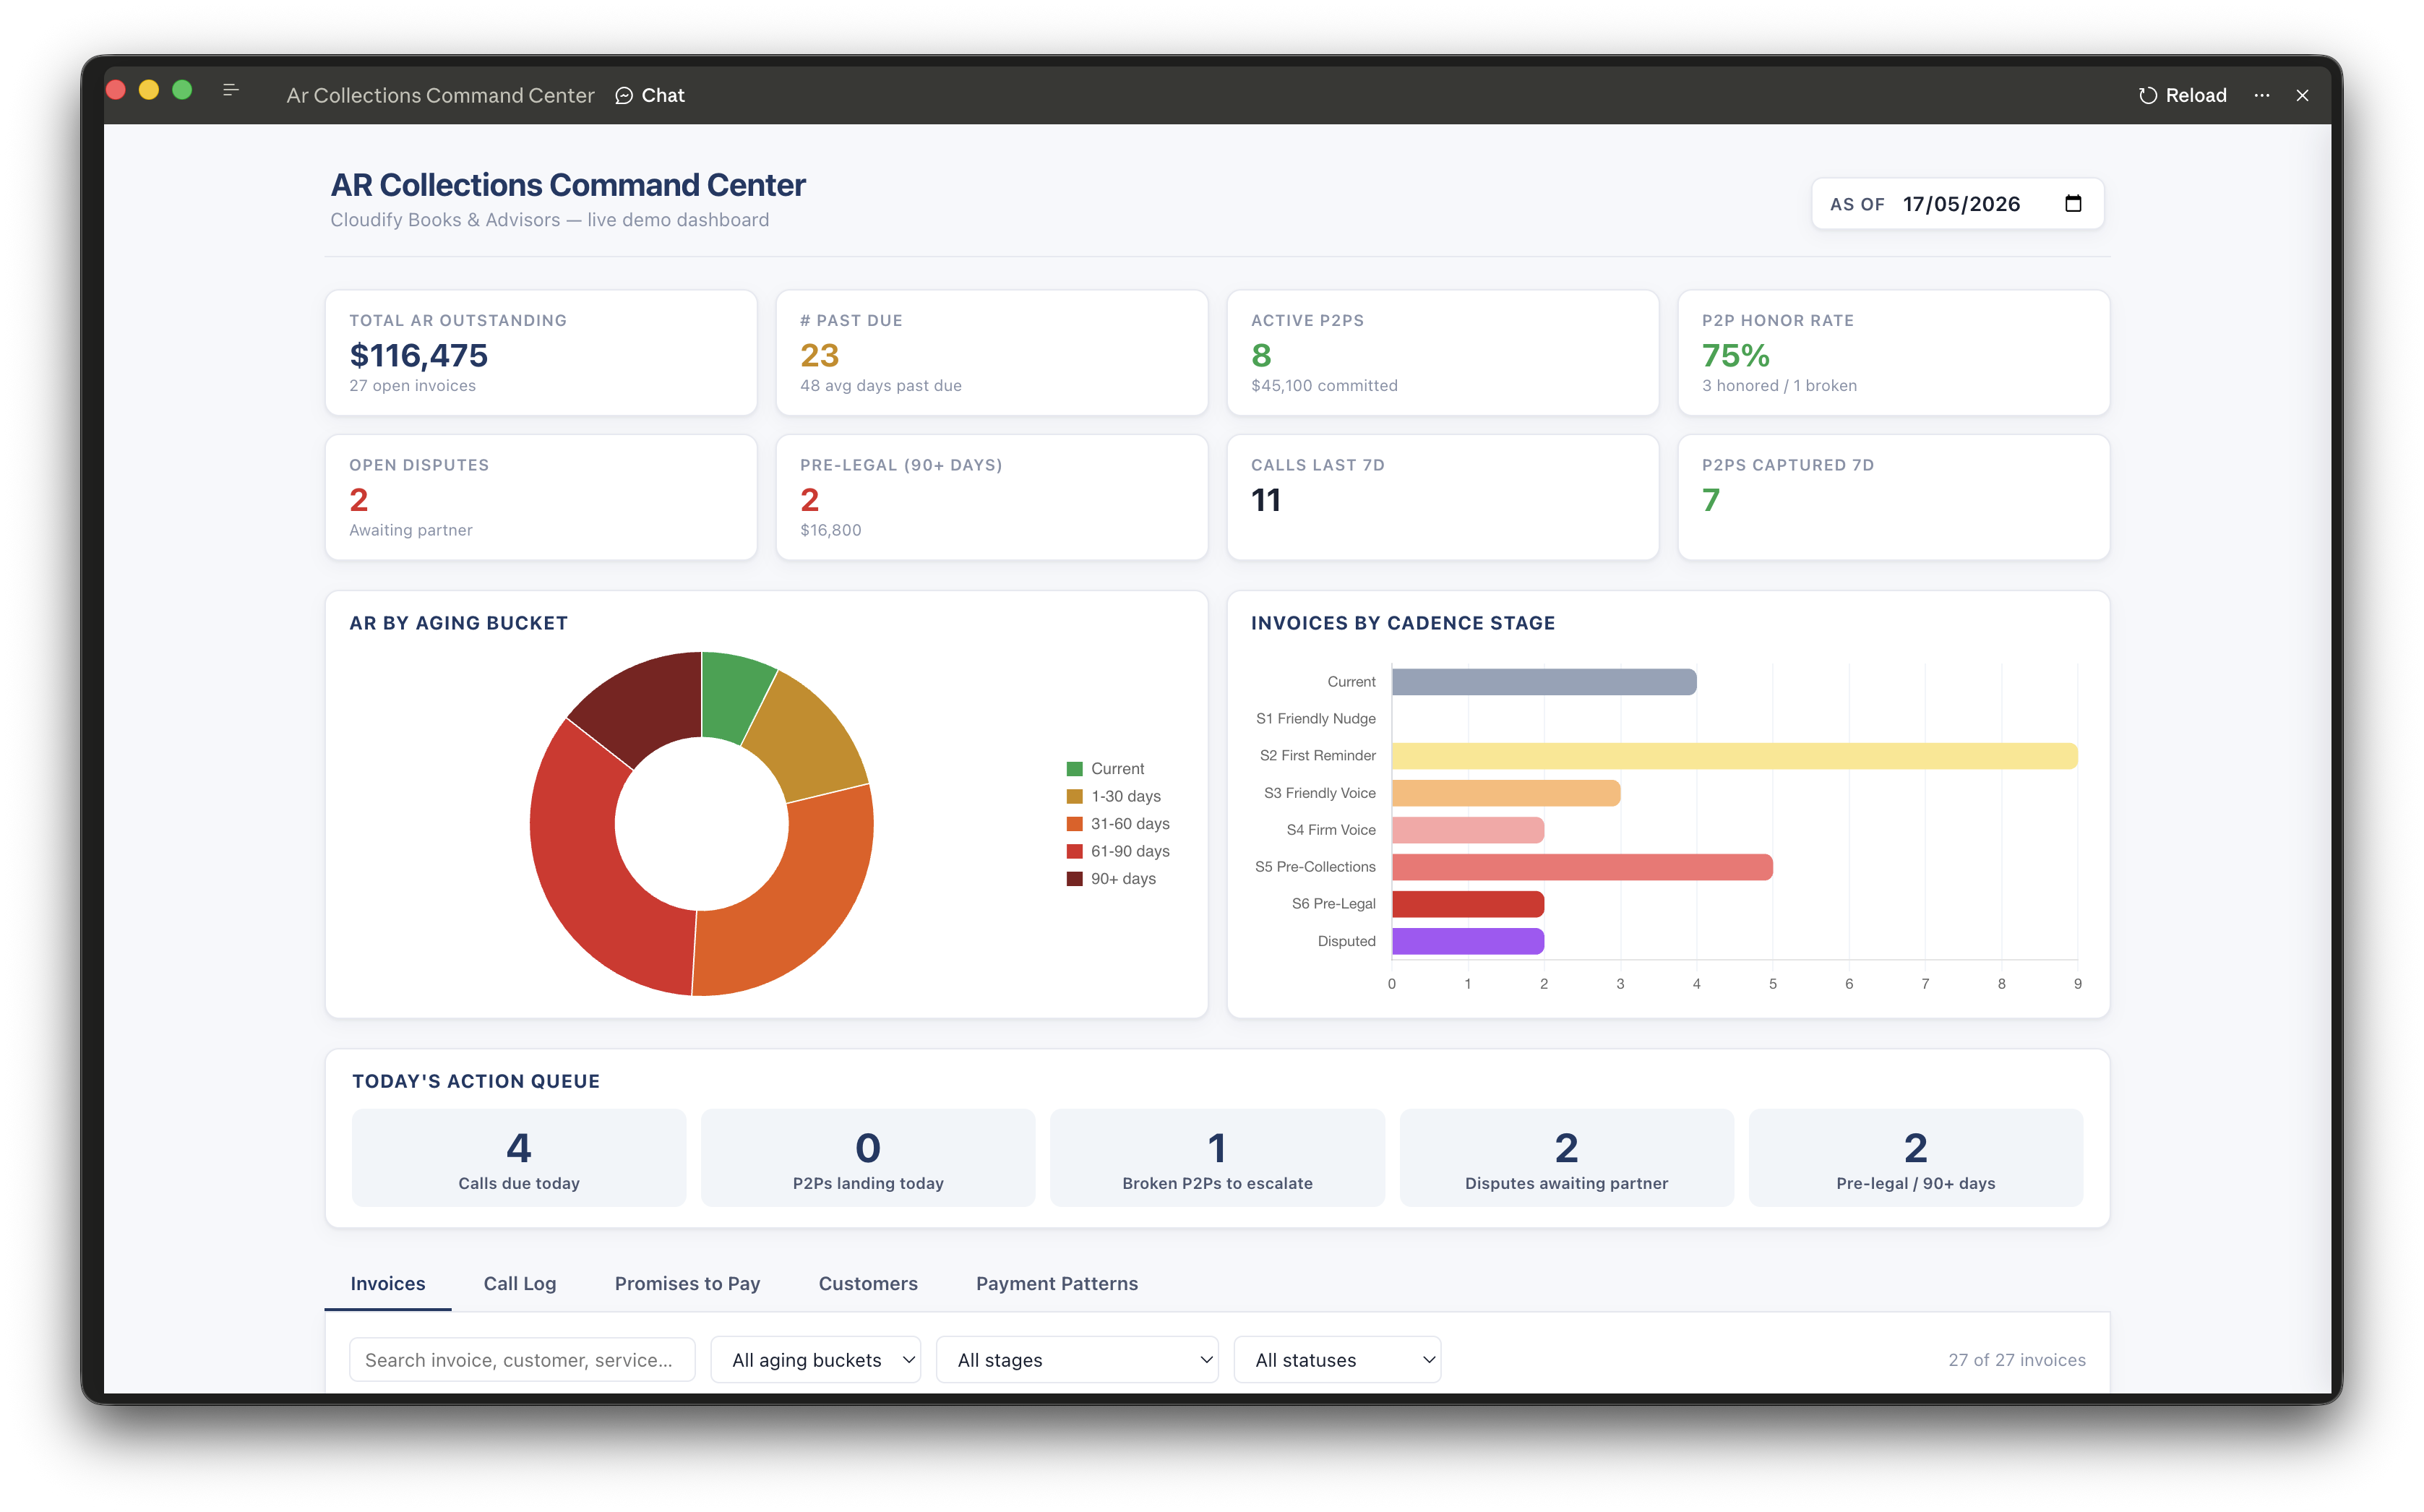
Headline KPIs
The top row surfaces the six numbers a collections manager needs before starting the day:
- Total AR Outstanding - $116,475 across 27 open invoices
- 23 invoices past due across all aging buckets
- 8 active Promises to Pay - $45,100 committed
- P2P Honor Rate - 75% - 3 honored, 1 broken in the current window
- 2 open disputes - both awaiting partner callback
- 2 pre-legal - $19,600 at 90+ days with no resolution
Each metric is a live formula. Change the As_Of_Date in the Config sheet, re-upload, and every number shifts.
AR by Aging Bucket
The donut chart splits outstanding balance into five buckets: Current, 1-30 days, 31-60 days, 61-90 days, and 90+ days. In this demo, roughly a third of the balance is current (not yet overdue), a third is in the 1-60 day range where email and SMS follow-up is still working, and the remaining third is split between 61-90 days (firm voice stage) and 90+ days (pre-legal).
This chart tells you at a glance whether your AR problem is concentrated in early-stage slow payers (fixable with tighter cadence) or in a small number of large stuck invoices that need human or legal escalation.
Invoices by Cadence Stage
The horizontal bar chart shows how many invoices are at each stage of the follow-up cadence:
- Current - not yet past due, no action needed
- Stage 1 - Friendly Nudge (1-15 days) - soft email
- Stage 2 - First Reminder (16-30 days) - polite-firm email + SMS
- Stage 3 - Friendly Voice (31-45 days) - AI voice outreach
- Stage 4 - Firm Voice (46-60 days) - direct tone, payment request
- Stage 5 - Pre-Collections (61-90 days) - escalated
- Stage 6 - Pre-Legal (90+ days) - attorney involvement pending
- Disputed - paused pending partner resolution
In the demo, Stage 2 has the most invoices - eight clients who received a first email but have not responded or paid. That is the highest-leverage bucket: one targeted AI voice call at this stage prevents the invoice from sliding into Stage 3 and beyond.
Today's Action Queue
Below the charts, the action queue surfaces exactly what needs to happen today:
| Action | Count |
| Calls due today | 4 |
| P2Ps landing today | 0 |
| Broken P2Ps to escalate | 1 |
| Disputes awaiting partner | 2 |
| Pre-legal / 90+ days | 2 |
This is the morning briefing. Four calls due, one broken promise that needs a firm follow-up call, two disputes blocked on a partner - those are the five things the AR manager or AI agent needs to act on before anything else.
The Data Tab Breakdown
The bottom of the dashboard has five navigable tabs that let you drill into any row.
Invoices tab - Search by customer or invoice number, filter by aging bucket and stage. Each row shows the balance, status, days past due, stage, last contact date, and next follow-up date. Clicking a row surfaces the notes column - where the AI call summaries live.
Call Log tab - Every outreach attempt in reverse chronological order. Outcome (Connected-Promise, Voicemail, Connected-Dispute), sentiment, whether a P2P was captured, and the full AI summary. This is where you find entries like: "Owner Maria apologized for delay; check being cut Friday. Strong relationship signal." or "4th consecutive missed attempt. AI recommends channel switch and human escalation."
Promises to Pay tab - All active P2Ps sorted by promise date. Shows the invoice, customer, amount, confidence score, and status. Color-coded: green for Honored, red for Broken, grey for Pending.
Customers tab - Client risk profile: risk tier (Low/Medium/High), avg days to pay, P2P honor rate, best contact window, preferred channel. This is what the AI agent reads before every call to personalize the opening.
Payment Patterns tab - Behavioral analysis per client. Northwind Realty, for example, has an avg of 51 days to pay with a standard deviation of 12 and a P2P honor rate of 60% - which means the AI knows to flag any payment commitment from that client as medium-confidence and schedule a backup escalation.
What Makes This More Than a Chart
The accounts receivable dashboard is useful on its own, but it becomes genuinely powerful when you connect it to the automation layer.
The Call_Log sheet is designed to be written to by a Vapi AI voice agent via an n8n or Zapier webhook. Every call the AI agent makes gets logged back into the spreadsheet - outcome, sentiment, P2P captured, confidence score, and a Claude-written summary of what was said. The Promises_to_Pay sheet gets a new row whenever a P2P is captured. When you re-upload (or sync via Google Sheets), the dashboard reflects all of it.
The Follow_Up_Cadence sheet feeds the automation rule engine: at 31 days past due, switch from email to AI voice. At 60 days with no P2P captured, escalate to human. At 90 days, flag for pre-legal. Claude reads these rules and applies them when generating next-follow-up dates on every invoice row.
What you end up with is a closed loop: AI calls, writes back to the sheet, the dashboard updates, and the cadence rules drive the next action - all without anyone manually maintaining a collections log.
If you want to go deeper on the automation layer, read how to automate accounts receivable end-to-end and see the AR automation service page for what a fully built system looks like.
Adapting This for Your Firm
The tracker is built for a multi-client accounting firm but the structure applies to any B2B business with recurring invoices. A few things to change:
- As_Of_Date in Config - set this to today's date and aging recalculates across every invoice automatically.
- Customers sheet - replace the demo clients with your own. The risk tier, preferred channel, and best call window fields are what the AI uses to personalize outreach.
- Follow_Up_Cadence - adjust the day thresholds to match your payment terms. If you work with Net 45 clients, the "Friendly Nudge" stage should start at day 15, not day 1.
- Channel_Preference on the Invoices sheet - set this per invoice based on what you know about each client. Some clients respond to email; others only respond to a direct call.
Once the sheet reflects your actual data, upload it to Claude Cowork and the dashboard builds itself to match.
Frequently Asked Questions
Does Claude Cowork work with Excel files or only Google Sheets? Claude Cowork reads both Excel (.xlsx) and CSV files directly. For a live connection that updates without re-uploading, export your tracker to Google Sheets and give Claude the share link. The dashboard will pull fresh data each session.
Do I need to know how to code to build this dashboard? No. You paste the prompt from Step 2 above, Claude generates the React artifact, and you click Pin. All customization happens through follow-up chat messages - "make the aging chart a bar chart," "add a filter for high-risk clients only," and so on.
Can I share the dashboard with my team? Yes. Anyone added as a collaborator to the Claude Cowork project can open the pinned Live Artifact. They see the same dashboard and can interact with it without affecting your chat history.
What is a Promise to Pay (P2P) and how does the tracker capture one? A Promise to Pay is a verbal or written commitment from a client to pay by a specific date. In the tracker, P2Ps are logged manually after a call, or automatically when an AI voice agent (Vapi) detects a payment commitment in the conversation and writes it back via webhook. The Promises_to_Pay sheet then tracks whether each commitment was honored or broken.
Can I use this for a single-entity business, not an accounting firm? Yes. The Customers sheet becomes your own client list, the Invoices sheet tracks your own AR, and you remove the multi-client columns you do not need. The aging logic, cadence stages, and dashboard structure all apply the same way.
What is the Follow_Up_Cadence sheet and how does the AI use it? The Follow_Up_Cadence sheet is a rule table that maps days-past-due ranges to channels, tones, and escalation triggers. At Stage 3 (31-45 days), the rule says use Voice/AI with a warm professional tone, maximum 4 attempts. Claude reads this table when you ask it to generate next-follow-up dates or build automation workflows, so the rules are applied consistently across every invoice.
Download the Template
The AR Calling Automation Tracker is free to use. It includes all nine sheets, the formula logic for aging and stage calculation, the cadence rule engine, and sample data from the Cloudify Books demo.
Download the AR Calling Automation Tracker (Google Sheets)
Pair it with the AR Prompt Playbook: 15 copy-paste Claude Cowork prompts covering dashboards, collections outreach, call log analysis, dispute escalation, and cash forecasting, all built against this tracker's exact sheet and column names.
If you want help building the automation layer - the AI voice calls, the webhook write-back, and the n8n workflow that drives the cadence - get in touch. That is the part we build for accounting firms and B2B finance teams at RevExOS.