How to Build a Cash Collection Forecast from Your AR Aging Data with Claude Cowork
An AR aging report tells you what's owed. It doesn't tell you when you'll actually get paid. Here's how to build an honor-rate-weighted cash forecast on top of the same AR tracker, using Claude Cowork's Live Artifacts.
RevExOS
Q2C Consulting
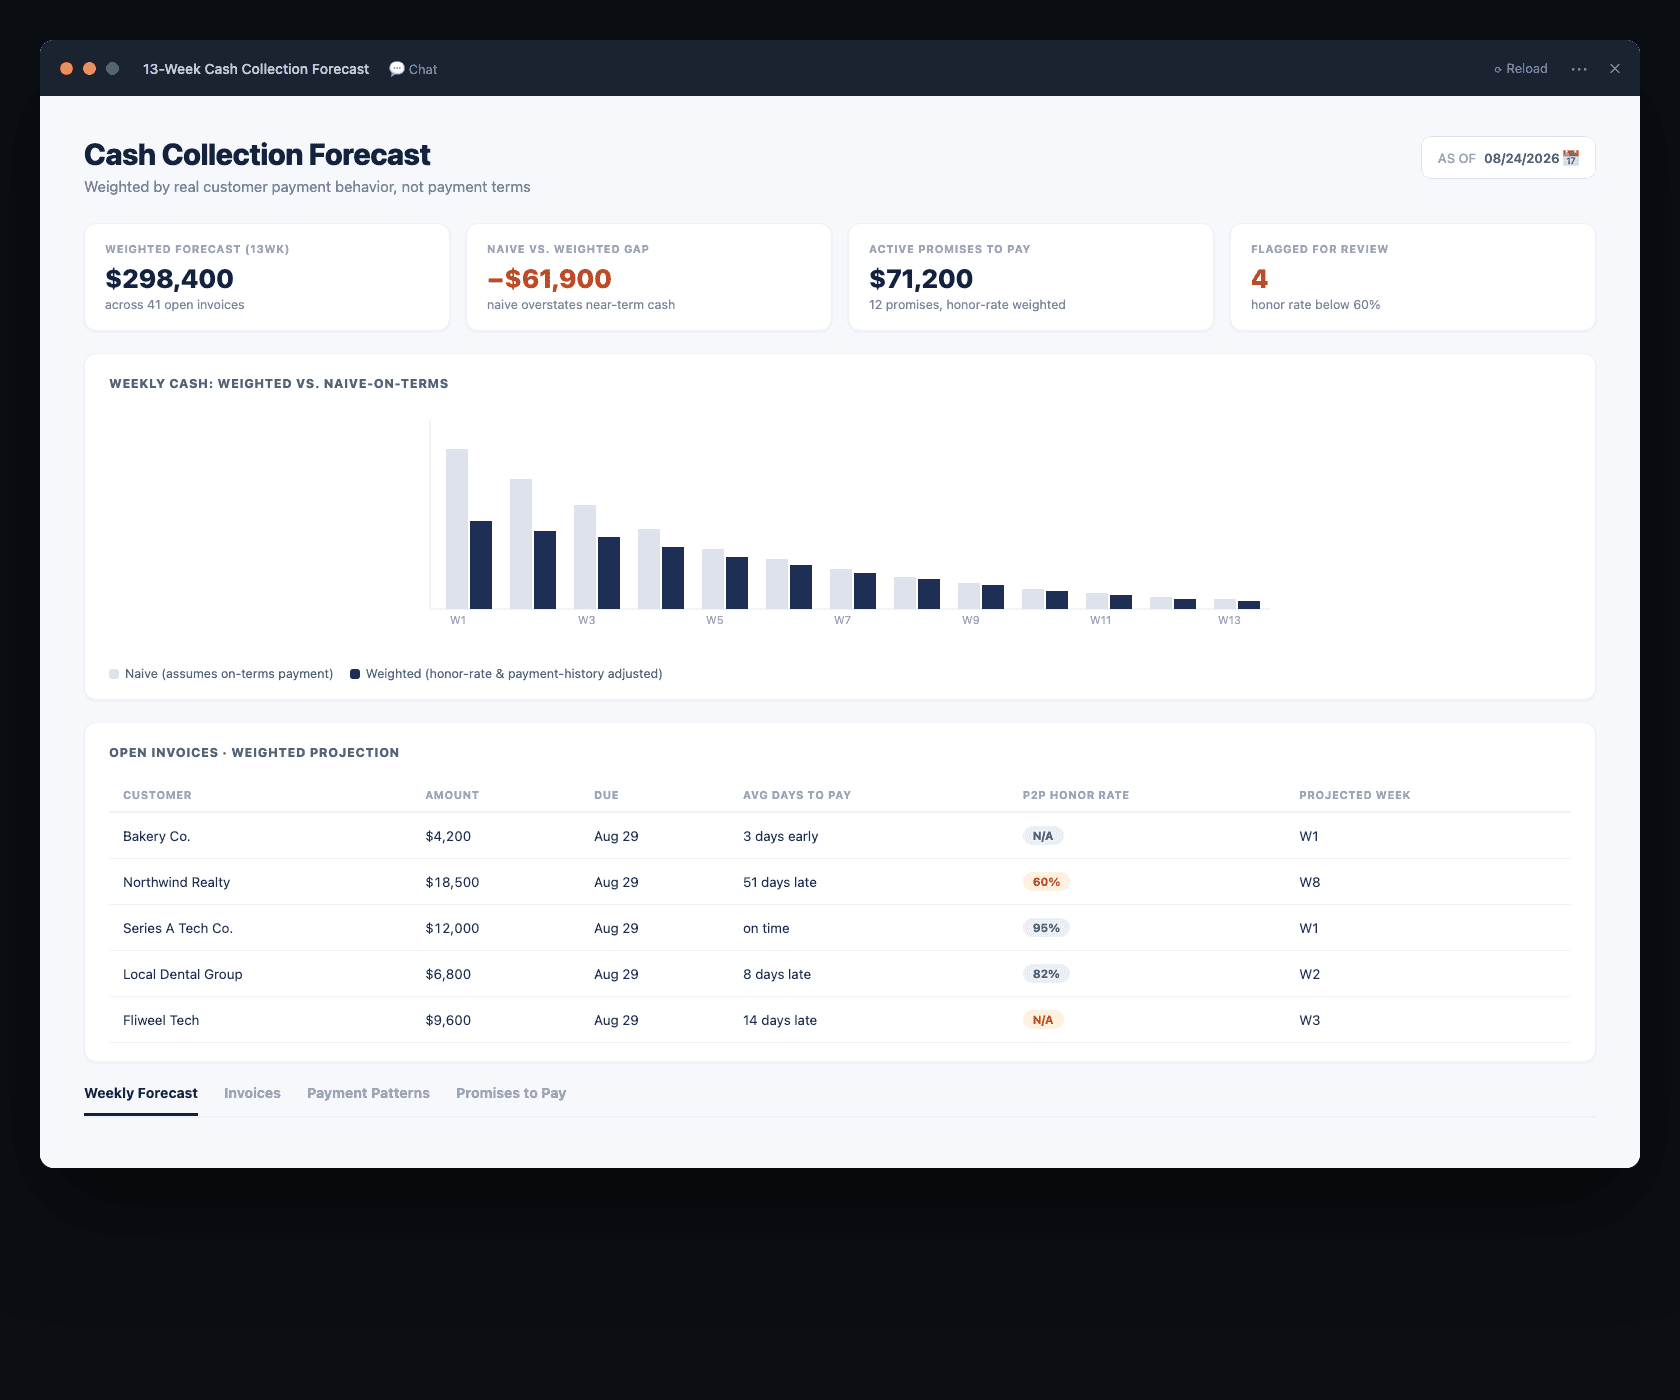
An AR aging report is a snapshot of what is owed. It is not a forecast of when you will actually have the cash. Most finance teams treat the two as the same thing: they sum up everything due in the next 30 days and call it the cash forecast. That number is almost always wrong, and it is wrong in a predictable direction - it overstates near-term cash, because it assumes every customer pays on the day their terms say they will, and no real customer book behaves that way.
Some customers pay two weeks early. Some pay two weeks late, every single time, like clockwork. Some make a promise to pay and honor it 90% of the time; others make the same kind of promise and honor it 40% of the time. A forecast that does not account for any of this is not a forecast, it is a restatement of the aging report with a different label.
This post shows how to build a real cash forecast on top of the same AR tracker used in the AR collections dashboard post, using Claude Cowork to weight every expected payment by that specific customer's actual payment behavior instead of a flat assumption. If you already have the AR Calling Tracker uploaded to a Cowork project, this is a direct extension of that same data. If not, download the free template first.
Why a Naive Forecast Is Wrong
Take five open invoices as an example:
| Customer | Amount | Due Date | Avg Days to Pay (historical) | P2P Honor Rate |
|---|---|---|---|---|
| Bakery Co. | $4,200 | In 5 days | 3 days early, on average | N/A - no P2P history |
| Northwind Realty | $18,500 | In 5 days | 51 days late, on average | 60% |
| Series A Tech Co. | $12,000 | In 5 days | On time | 95% |
| Local Dental Group | $6,800 | In 5 days | 8 days late, on average | 82% |
| Fliweel Tech | $9,600 | In 5 days | 14 days late, on average | N/A - no P2P history |
A naive forecast says all $51,100 lands within the next 5-10 days, because that is when the invoices are "due." A forecast that uses each customer's actual behavior tells a very different story: Bakery Co. and Series A Tech Co. are genuinely close to on time and should be counted in the near-term bucket. Northwind Realty, with an average of 51 days late and a 60% P2P honor rate, should be weighted into a bucket roughly 8 weeks out, discounted by the honor rate if there is an active promise. Local Dental Group and Fliweel Tech land somewhere in between.
The dollar difference between the two forecasts here is not small: the naive forecast puts $51,100 in the next 10 days, while the weighted forecast puts closer to $23,000 in that window, with the remainder spread across the following 6-8 weeks. If you are using the naive number to plan payroll, a vendor payment, or a draw against a line of credit, that gap is the difference between a forecast that works and one that quietly sets you up short.
The Data You Need
This builds directly on the same tracker as the AR dashboard post - specifically three of its sheets:
| Sheet | What It Contributes to the Forecast |
|---|---|
| Invoices | Open balance, due date, current aging bucket, assigned cadence stage per invoice |
| Payment_Patterns | Per-customer average days to pay (relative to terms), standard deviation, and P2P honor rate - this is the weighting data |
| Promises_to_Pay | Active promises with promise date and amount - these get weighted by the customer's honor rate rather than assumed 100% certain |
If you have not been tracking Payment_Patterns yet, Claude can derive a rough version of it directly from your invoice payment history (invoice due date vs. actual payment date, for every invoice paid in the last 6-12 months) - you do not need months of manual tracking to start, just historical AR data you likely already have in your accounting system. To check when a single invoice falls due under its terms (Net 30, Net 60, end of month), the free Invoice Due Date Calculator does it in one step.
Building the Forecast: Step by Step
Step 1 - Open your existing AR Cowork project (or start one)
If you already built the AR dashboard from the earlier post, use that same project - Claude already understands your schema. If not, create a new Cowork project and upload the Invoices, Payment_Patterns, and Promises_to_Pay sheets.
Step 2 - The build prompt
"Using my Invoices, Payment_Patterns, and Promises_to_Pay sheets, build a live 13-week cash collection forecast artifact. For each open invoice with no active promise, project a collection date using that customer's average days-to-pay from Payment_Patterns (default to the invoice due date if the customer has no payment history). For invoices with an active Promise to Pay, weight the promised amount by that customer's P2P honor rate, and split the balance between 'expected on promise date' (weighted) and 'expected later if broken' (the remainder). Bucket every invoice into weekly columns, show a weighted total per week, and a separate 'naive total assuming all invoices pay on terms' row so I can see the gap. Flag any customer with a P2P honor rate below 60% for manual review rather than automatic inclusion in the near-term forecast."
Claude builds a 13-week grid: each open invoice lands in the week matching its weighted expected collection date, promises get split by honor-rate confidence, and the naive-vs-weighted comparison row makes the accuracy gap visible at a glance rather than buried in a formula.
Step 3 - Pin and iterate
Pin the artifact. From here, useful follow-up requests: "add a confidence band showing best case and worst case per week," "break the forecast out by customer risk tier instead of just by week," or "add a running cumulative cash line so I can see the total collected-to-date trajectory against the forecast."
Reading the Weighted Forecast
Using the five-invoice example from earlier, a weighted forecast for Northwind Realty's $18,500 invoice (60% P2P honor rate, if a promise is in place) would show roughly $11,100 in the promised week and the remaining $7,400 pushed into a later week, reflecting the real probability that part of that promise slips or breaks. That is a materially more useful number for planning than either "all $18,500 arrives on the promise date" or "ignore the promise entirely."
This is the same logic behind the honor-rate-weighted forecasting section of the AR Prompt Playbook, applied here as a full standing dashboard rather than a one-off report you regenerate manually each week.
What to Do With Customers Flagged for Manual Review
Any customer with a P2P honor rate below 60% gets pulled out of the automatic near-term forecast and flagged instead. This is not a punishment for the customer, it is an accuracy safeguard: including a low-honor-rate promise at full weight in a forecast that leadership uses to plan cash makes the whole forecast less trustworthy, not more complete. Flagged customers still show up in the dashboard, just in a separate "needs judgment call" list rather than baked into the weighted total, so a controller can apply context the formula cannot - a customer who is late because of a known, resolving dispute is a different situation than a customer who is simply unreliable.
Adapting This for Your Business
- No P2P data yet? Start the forecast using only Payment_Patterns (average days to pay), and add the honor-rate weighting once you have a few months of promise-tracking data. A forecast weighted only by historical payment timing is still far better than a naive on-terms assumption.
- Seasonal customers - if certain customers pay predictably slower at specific times of year (a common pattern in industries like construction or education), add a Seasonality column to Payment_Patterns and ask Claude to factor it into the weighting for invoices due in those months.
- Multiple currencies - add a currency column to Invoices and ask Claude to either forecast per-currency or convert to a base currency using a rate you supply, depending on how your finance team reports.
- Connecting to actual collections - once a promise is honored or broken, update Promises_to_Pay, and re-upload. The forecast tightens as more of the current period resolves.
Frequently Asked Questions
How is this different from the AR aging dashboard? The aging dashboard tells you what is owed and how overdue it is, as of today. The forecast tells you when you are likely to actually receive it, weighted by real customer behavior rather than payment terms. They use the same underlying data but answer different questions - one is about outstanding balance, the other about future cash timing.
Do I need months of Payment_Patterns history before this is useful? No. Even a rough average-days-to-pay figure derived from your last 10-20 paid invoices per customer is more accurate than assuming everyone pays exactly on terms. The forecast gets more precise as the history grows, but it is useful from day one.
Can this replace a formal 13-week cash flow forecast that includes AP and payroll? Not on its own - this covers the AR collections side specifically. For a full cash flow picture, combine this artifact's weekly collection projections with your AP schedule and payroll calendar, either by uploading those alongside the AR data or by exporting this forecast into your existing cash flow model.
What if a customer's payment behavior changes suddenly - do I need to rebuild the whole tracker? No. Update that customer's row in Payment_Patterns with the new average and honor rate, re-upload, and every projection using that customer's data recalculates automatically across the forecast.
 Claude